
How to Run Downtime Analysis in Aviation Maintenance

How to Run Downtime Analysis in Aviation Maintenance
IATA’s Airport Handling Manual categorizes downtime into planned Technical Grounding and Unplanned Technical Grounding, and tracking both separately is what makes the analysis mean anything. A tool like SquawkFree can automate the capture piece for general aviation fleets but the discipline behind it matters more than any software.
Here’s what to do in the next 72 hours:
- Turn on reason-code logging in your maintenance system, even if it’s a basic tiered list at first.
- Assign one person to own the downtime dashboard, even if that dashboard is a spreadsheet for now.
- Pull the last 12 months of reactive work orders and run a quick Pareto chart by reason code.
Proactive programs built on this foundation cut maintenance downtime by 30 to 50% once reason codes and OEE tracking are in place.
Key Takeaways
Cutting aviation downtime requires standardized reason-code logging, consistent MTTR/MTBF/OEE tracking, and weekly Pareto reviews targeting the small share of assets driving most unplanned failures.
| Point | Details |
|---|---|
| Log reason codes immediately | Assign a standardized code the moment a stop happens, never reconstruct it later from memory. |
| Track the core five metrics | MTTR, MTBF, TAT, dispatch reliability, and OEE together, benchmarked against top-quartile targets. |
| Prioritize chronic assets | Roughly 10 to 15% of assets typically generate 70 to 80% of unplanned downtime hours. |
| Fix process before buying tools | PM compliance and first-visit-fix improvements usually deliver faster ROI than predictive software. |
| Quantify deferral trade-offs | Model network ripple effects, not just repair cost, before deciding to delay maintenance. |
| Automate GA data capture | SquawkFree’s Flight Intelligence and AD tracking remove manual entry gaps common in smaller fleets. |
Table of Contents
- What Downtime Analysis in Aviation Actually Measures
- How Do You Capture Downtime Events Without Losing Accuracy?
- Which Analysis Methods Actually Reduce Downtime?
- Where Predictive and Prescriptive Maintenance Fit In
- Operational Levers That Cut Downtime This Month
- How Do You Put a Dollar Figure on Downtime?
- Building a Downtime Analysis Program That Sticks
- SquawkFree Gives GA Operators a Practical Starting Point
- Frequently Asked Questions
- Sources
What Downtime Analysis in Aviation Actually Measures
Uptime is when an aircraft is available for revenue flying. Downtime is everything else, and the split between planned and unplanned matters more than most maintenance teams treat it. IATA’s framework distinguishes Technical Grounding from Unplanned Technical Grounding, which forces you to separate scheduled maintenance from failures you didn’t see coming. That distinction drives your maintenance strategy, since unplanned downtime often costs 3 to 5 times more per hour than planned work.
| Metric | Formula | Unit | Benchmark |
|---|---|---|---|
| MTTR | Total repair time ÷ number of repairs | Hours | Lower is better; track trend, not absolute value |
| MTBF | Total operating time ÷ number of failures | Hours | Rising trend signals reliability improvement |
| TAT | Job completion time minus job start time | Hours | Fleet and shop-dependent baseline |
| Dispatch reliability | (Departures without delay ÷ total departures) × 100 | Percent | High percentage for mainline carriers |
| OEE | Availability × performance × quality | Percent | Above 80% for top-quartile ops |
| First-visit fix rate | Jobs closed on first visit ÷ total jobs | Percent | Approximately 85% target |
How Do You Capture Downtime Events Without Losing Accuracy?
Accurate downtime analysis depends entirely on what gets logged the moment an aircraft stops, not on what someone remembers writing down later. The minimum event record needs a start and end timestamp, station or airport, aircraft registration, system or ATA chapter, a standardized reason code, the technician who opened the event, and any linked work order or parts pulled.
A workable reason-code schema breaks into five buckets: mechanical, avionics, human/operator, supply/parts, and procedural. Under mechanical you might have engine, hydraulic, and structural sub-codes; under supply/parts, back-order, wrong-part, and warehouse-transit sub-codes.
- Assign the reason code at event creation, not during the weekly report.
- Use automatic stop detection from flight-data import where it exists, rather than relying on manual entry.
- Enforce a “Ready to Work” check, confirming parts and crew are staged before the clock starts on labor time.
- Timestamp interruptions separately from active repair time so hold periods don’t distort MTTR.
Starting work before parts are staged is one of the most common ways operators inflate their own downtime numbers without realizing it.
Pro Tip: Add a “parts reserved” checkbox to every work order before dispatch. Crews that confirm parts availability before starting a job routinely report faster first-visit fixes, because half of repeat visits trace back to missing or wrong parts.
Solid recordkeeping here also keeps you aligned with FAA guidance on maintenance records, which matters both for compliance and for building a clean audit trail.
Which Analysis Methods Actually Reduce Downtime?
Raw downtime logs are only useful once you run the right analysis against them. Four methods carry most of the weight in a maintenance operation.
- Pareto analysis ranks reason codes by total hours lost, run weekly to find your top three offenders.
- Trend analysis tracks a component or fleet’s degradation over time, run monthly on your 20 highest-risk assets to catch decline before it becomes a failure.
- Defect analysis clusters recurring failure signatures across the fleet to expose design or maintenance-procedure gaps.
- Root cause analysis goes deep on high-cost events, usually anything above a defined dollar or hour threshold.
Statistically, moving averages smooth short-term noise in trend data, control charts flag drift before it crosses a failure threshold, and survival analysis gives you a defensible MTBF estimate when failure data is sparse. Trend analysis in particular is what lets operators time interventions instead of reacting to them.
The prioritization logic behind all of this rests on one number worth memorizing: roughly 10 to 15% of your assets generate 70 to 80% of unplanned downtime. Find those chronic assets first, and everything else in your analysis program becomes secondary.
Where Predictive and Prescriptive Maintenance Fit In
Predictive maintenance runs on a straightforward pipeline: edge sensors feed data ingestion, which feeds feature engineering, which feeds a model, usually a Remaining Useful Life (RUL) estimator or an anomaly detector, that triggers a work order or maintenance recommendation.
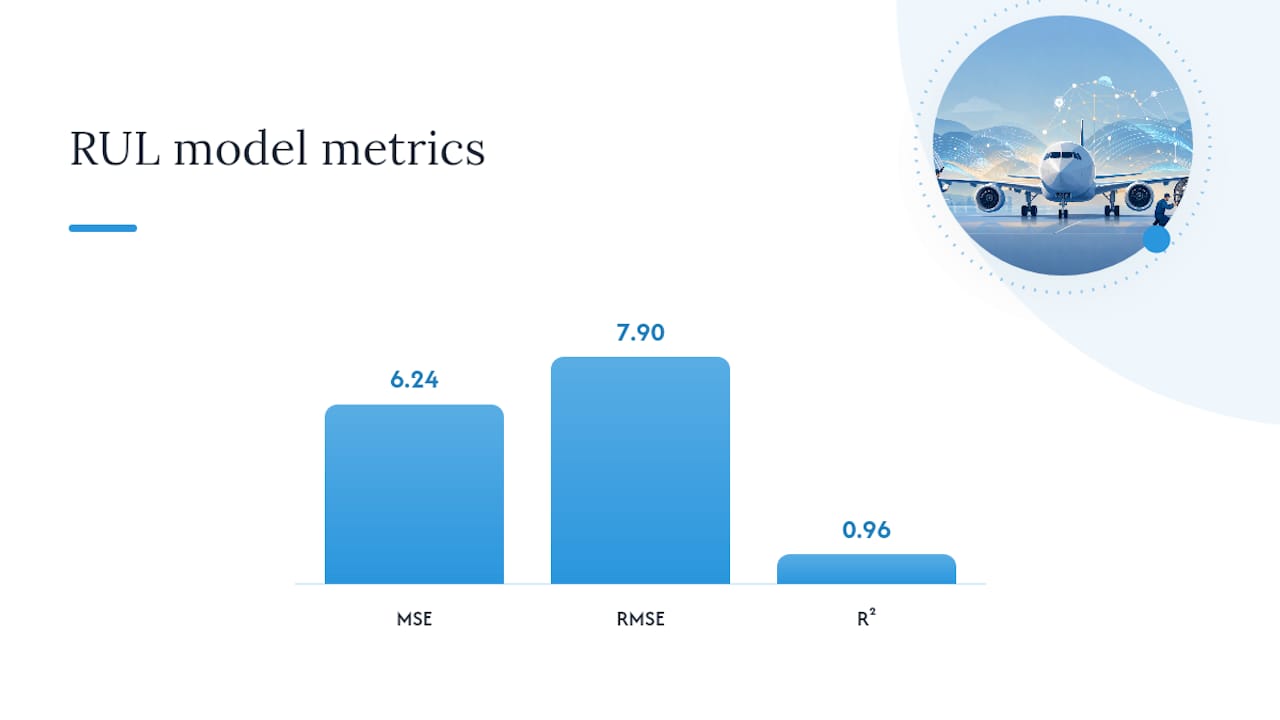
Model choice matters. Condition-based triggers work fine for simple thresholds, but hybrid approaches tend to outperform single-model setups. A 2026 study combining feature selection with Random Forest and LSTM reported an MSE of 6.24, RMSE of 7.90, and R² of 0.96 for RUL prediction, strong enough that the model flagged early maintenance for a subset of engines before failure indicators were obvious to a human reviewer.
Validation has to be rigorous before you trust any of this operationally:
- Split fleet data by time window, not randomly, so the model is tested on data it hasn’t seen chronologically.
- Track MSE, RMSE, and R² for RUL accuracy, and check false-alarm rate against what your maintenance team can actually tolerate.
- Map predictive outputs to real actions: schedule a PM window, pre-stage parts, or open a priority work order automatically.
Pro Tip: Pilot predictive models on 10 to 20 aircraft or engines before fleet-wide rollout. Validate precision and recall against real outcomes first; a model that looks great on paper but generates false alarms will burn trust with your maintenance crews fast.
Operational Levers That Cut Downtime This Month
You don’t need a predictive model to start reducing downtime. Several process changes deliver results within weeks.
- Map spare-part criticality and stock high-failure items locally instead of relying on centralized warehouses.
- Improve first-visit fix rate by attaching full asset history and reserved parts to every work order before a technician arrives.
- Deploy guided troubleshooting procedures and digital job cards so less-experienced technicians aren’t starting from scratch on recurring issues.
- Staff for peak demand, with trained on-call rosters and staged crews ready for heavy checks.
- Enforce “Ready to Work” verification so labor time doesn’t start until parts and crew are actually staged.
- Consolidate planned work into low-demand windows to keep PM compliance high and reactive failures low.
Operators combining mobile work orders, parts staging, and first-visit-fix preparedness commonly see MTTR drop by 30 to 45%.
Pro Tip: Before buying analytics software, fix PM compliance and first-visit-fix rates first. Those two levers deliver faster ROI than most predictive tools, because they attack the dead time hiding inside your existing process.
How Do You Put a Dollar Figure on Downtime?
Downtime cost is never just the repair bill. A complete figure includes direct repair cost (labor and parts), revenue loss from a canceled or delayed flight, subcharter or lease costs to cover the gap, network delay ripple effects and crew or slot penalties.
| Cost component | What to include | Example driver |
|---|---|---|
| Direct repair | Labor hours, parts, shop fees | AOG mechanical fix |
| Revenue loss | Missed flights, rebooking costs | Canceled leg |
| Subcharter/lease | Backup aircraft or lease cost | Coverage during AOG |
| Network ripple | Downstream schedule changes | Crew and slot conflicts |
A documented case involving a 54-aircraft fleet found that rescheduling maintenance to avoid a single flight cancellation triggered about 13 schedule changes and 10 hours of additional network-wide delay over two weeks. That’s the kind of ripple effect a simple repair-cost estimate never captures.
For a fast tactical call:
- Compute the immediate direct cost of fixing now versus deferring.
- Model the network ripple for the next 48 hours if you defer.
- Compare that total against subcharter or lease cost for the gap.
Downtime cost models that separate subcharter cost from pure opportunity cost give operators a much stronger negotiating position with MRO providers.
Building a Downtime Analysis Program That Sticks
A downtime analysis program needs governance before it needs software. Assign clear roles: someone owns the reason-code taxonomy, someone owns the dashboard, someone owns validation of predictive outputs against real outcomes.
Implementation checklist:
- Define your reason-code taxonomy and get every shift trained on it.
- Select tooling: a CMMS with mobile capture, condition sensors on critical systems, a dashboard layer.
- Pick a pilot scope, ideally your top 20 critical assets or a small fleet segment.
- Run a 90-day data capture window and track MTTR, first-visit-fix rate, and OEE against baseline.
- Evaluate results and build the scaling plan with a realistic timeline and named owners.
Tooling checklist: mobile-capable CMMS, condition monitoring where failure cost justifies it, a data integration layer pulling from AOG reports and flight operations, a visualization dashboard, and automated work-order creation tied to reason codes.
For general aviation owners and flight schools, SquawkFree fits this checklist directly. Its Flight Intelligence feature auto-imports flight data without manual entry, which removes the biggest source of missing downtime records in smaller fleets, and its AD tracking keeps compliance events from becoming surprise groundings.

A Maintenance Manager’s Take on Making This Work
The hardest part was never the metrics. It was getting technicians to log a reason code at the moment a stop happens instead of reconstructing it later from memory. Once that habit took hold, parts staging and PM compliance delivered the fastest visible ROI, faster than any predictive model we piloted. The cultural shift, not the software, is what determined whether the numbers held up six months later.
SquawkFree Gives GA Operators a Practical Starting Point
If your fleet is small enough that a full CMMS rollout feels like overkill, SquawkFree gives you most of the downtime analysis foundation without the enterprise price tag or the manual data entry. Automated flight-data import removes the biggest gap in most GA maintenance logs, reason-coded logging keeps your Pareto reviews honest, and integrated AD tracking means compliance events don’t blindside your schedule.
A 90-day pilot is a realistic starting point: pick your highest-utilization aircraft, turn on automated flight logging, and track how your first-visit-fix rate and PM compliance shift against baseline. Mobile work orders and dashboards built around MTTR, MTBF, and OEE let you see the trend without building a spreadsheet from scratch. If you manage a fleet or run a flight school and want to see how the platform handles your maintenance history and AD compliance, start with SquawkFree and evaluate it against your current process directly.
Frequently Asked Questions
What is the difference between planned and unplanned downtime in aviation? Planned downtime covers scheduled maintenance events, while unplanned downtime, or Unplanned Technical Grounding in IATA’s framework, covers unexpected failures. Unplanned events typically cost far more per hour than scheduled work.
Which metrics matter most for downtime analysis aviation programs? MTTR, MTBF, TAT, dispatch reliability, and OEE form the core set. First-visit fix rate is a strong secondary indicator of whether technicians have the information and parts they need.
How often should a maintenance team run Pareto analysis? Weekly reviews of reason codes by total hours lost catch emerging problems fast enough to act on. Monthly trend analysis on your highest-risk assets catches slower degradation.
Does predictive maintenance replace reason-code logging? No. Predictive models depend on clean historical data, and reason-code logging is what makes that data usable in the first place.
How does SquawkFree support downtime tracking for general aviation? SquawkFree automates flight-data import through Flight Intelligence, tracks AD compliance, and centralizes maintenance history, which reduces manual entry gaps that commonly distort downtime data in smaller GA fleets.
Sources
- IATA Airport Handling Manual (AOA) — 2nd edition (2022) — downtime metrics guidance
- OEE implementation guide — TMEP / University of Tennessee
- Student/academic analysis on maintenance rescheduling impacts — ERAU commons
- FAA advisory circulars — maintenance and records
Recommended
No credit card required · read-only after trial