
From QR Code to Work Order: Oil Analysis Tracking for Fleets
From QR Code to Work Order: Oil Analysis Tracking for Fleets
Oil analysis tracking is the system of record that shows you exactly where every fluid sample stands, from bottle registration to final report, and pushes actionable results straight into your maintenance workflow. For fleet and equipment managers, the payoff is immediate: no more digging through email for a report that landed three weeks ago. You get sample status, alerts on abnormal readings, downloadable PDF results, and trend graphs, all in one dashboard. The first move is simple: register your sample bottle with its QR code and confirm your alert routing before you ship it.
TL;DR:
- Automated alerts and equipment linking ensure critical oil analysis results trigger immediate maintenance actions, reducing response times.
- Role-based access and export options support larger fleets by streamlining data management and historical trend analysis.
- Consistent asset identifiers and integrated workflows between lab portals and maintenance systems enable seamless, automated work order creation.
- Sensor-based real-time monitoring complements lab analysis by detecting imminent failures, but does not replace detailed chemical diagnostics.
- Proper sample submission, timely tracking, and ownership of follow-up actions are essential to closing the visibility gap from sample collection to corrective maintenance.
Table of Contents
- How Sample-Tracking Portals and Lab Dashboards Work
- Key Features to Require in an Oil Analysis Tracking System
- Connecting Lab Results to Maintenance Action
- Real-Time Oil Condition Monitoring vs. Lab Analysis: How They Complement Each Other
- Turnaround Time, Costs, and How to Submit a Sample for Tracking
- Closing the Visibility Gap From Sample to Action
- Another Option: Closing the Loop With Maintenance Management Software
- Sources
- FAQ
How Sample-Tracking Portals and Lab Dashboards Work
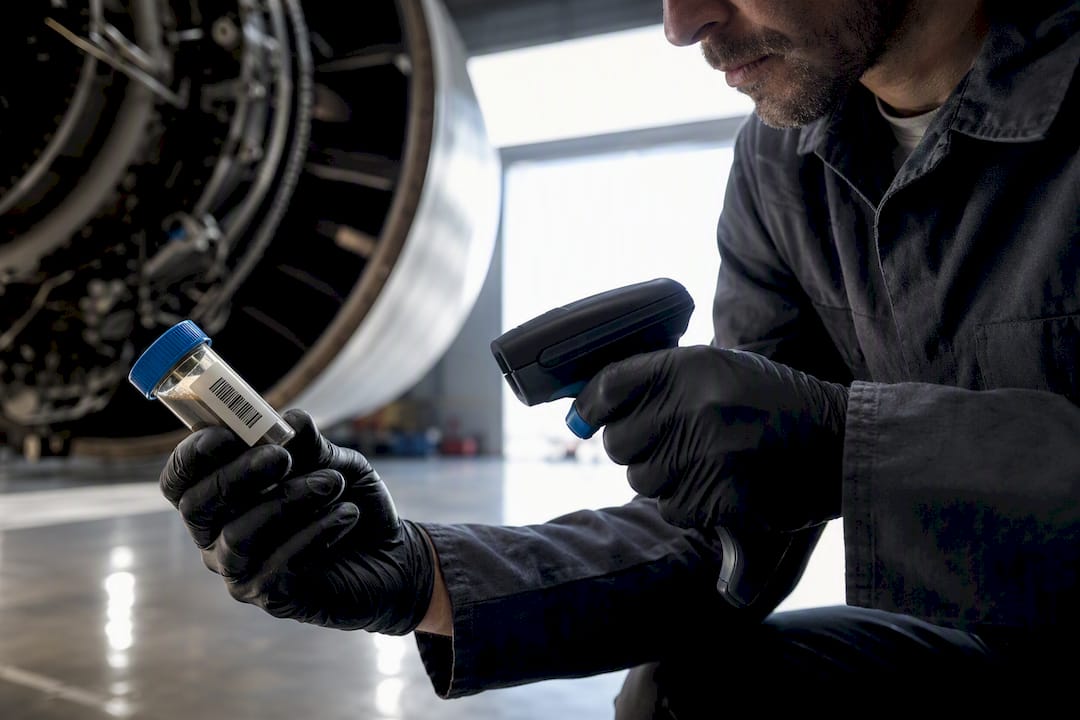
Every sample starts with registration. You scan or enter a barcode, link it to a specific equipment ID, and that unique code follows the sample through every stage of testing. Skip this step and results become almost impossible to trace back to the right compressor, engine, or gearbox.
Most lab portals display sample progress in plain stages: in transit, received at the lab, in analysis, undergoing quality assurance, and finalized. LOAMS from Bureau Veritas organizes this exact workflow, along with a searchable inbox, trending charts, and downloadable reports.
A well-built dashboard typically includes:
- A sample inbox that flags new and critical results without forcing you to search old emails.
- Filters by equipment, date range, or lab location.
- Trend graphs plotting wear metals and viscosity over multiple samples.
- Role-based access so technicians see only what applies to their unit, while managers see the whole fleet.
Multi-person teams need that access control. A technician submitting samples from the field doesn’t need visibility into billing or account settings, but a maintenance planner does need to see every asset’s history at once.
Key Features to Require in an Oil Analysis Tracking System
Not every portal offers the same depth. Before you commit to one, run it against a short checklist built around what actually saves time on the shop floor.
- Automated alerts that flag abnormal wear metals or viscosity shifts without you having to open every report manually.
- Equipment linking so results attach automatically to the correct asset, not a generic customer account.
- API or CSV export so data can flow into your own analytics or CMMS without retyping numbers.
- Barcode or QR support for fast, error-free sample registration in the field.
- SLA and priority processing so a critical sample doesn’t sit in the same queue as routine monitoring.
- Mobile access with offline entry, useful when you’re sampling in a hangar or shop with no signal.
- A clear summary score or status index instead of a wall of raw numbers.
Pro Tip: Ask any lab portal you’re evaluating for a demo of their historical trending view before you sign up. A tool that shows five years of wear-metal data on one graph is far more useful than one that only shows the latest report.
Role-based permissions and exportable historical data matter more as your fleet grows. A two-truck operation can manage with email. A fifty-asset fleet cannot.
Connecting Lab Results to Maintenance Action
A report sitting unread in an inbox does nothing for your equipment. The real value of oil analysis tracking shows up when a flagged result automatically becomes a work order, not just a PDF someone has to remember to act on.
That connection starts with consistent asset identifiers. Whether you use VINs, tail numbers, or internal component tags, the same ID needs to appear on the sample label and in your maintenance system, or the two records never link up.
From there, teams typically use one of a few integration paths:
- API pushes that send structured result data directly into a CMMS, creating a pre-filled work order automatically.
- Email-to-CMMS routing, where a flagged report triggers a ticket through an automated rule.
- Manual PDF attachment to the asset’s history, which works but adds friction and invites missed follow-ups.
An effective workflow looks like this: sample gets scanned in, lab flags high iron content, the portal pushes an alert to the assigned technician, and a work order opens in the CMMS within minutes, not days. Track three numbers to know if your program is actually working: average transit time from field to lab, time-to-action after an alert fires, and the percentage of flagged samples that get investigated and corrected.
Real-Time Oil Condition Monitoring vs. Lab Analysis: How They Complement Each Other
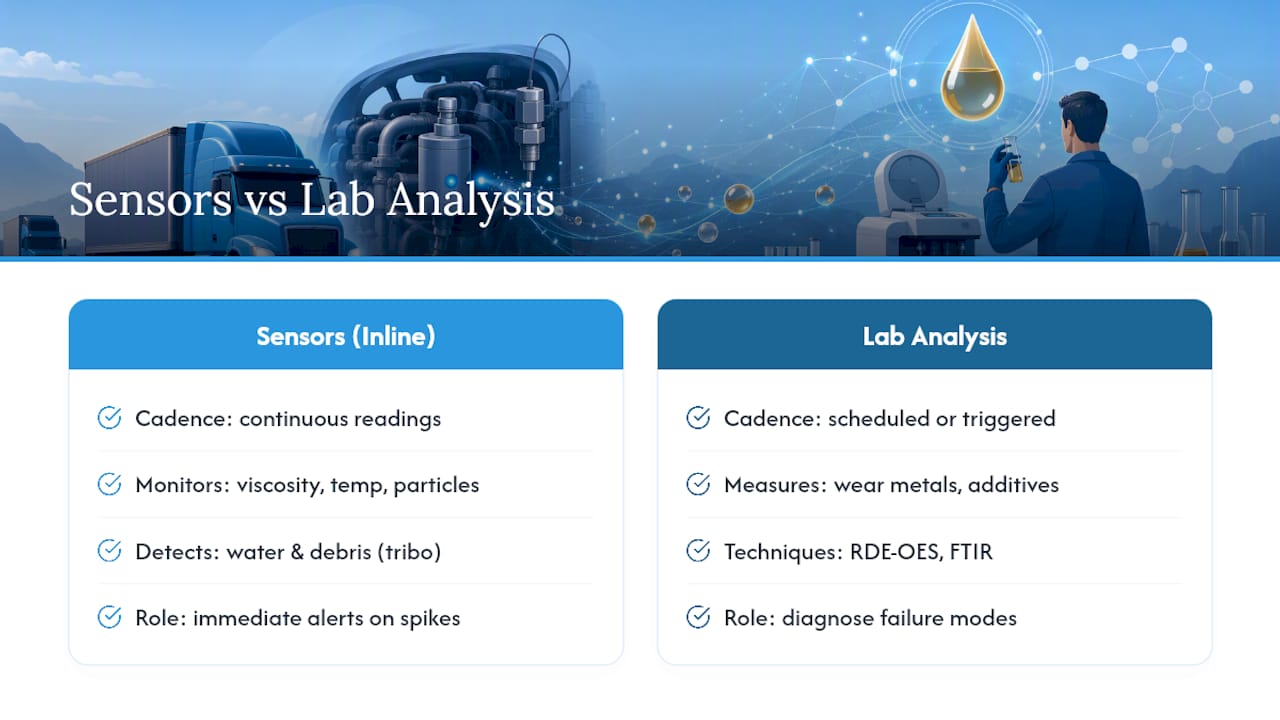
Inline sensors and lab tests answer different questions, and mixing them up wastes money on either end. Field sensors give you continuous readings on viscosity, temperature, and particle counts, catching a spike the moment it happens. Lab analysis, using techniques like RDE-OES spectrometry and FTIR, identifies exactly which wear metals are present and how far additive depletion has progressed, detail no onsite sensor can match.
Emerging triboelectric sensors can now detect very low levels of water and debris in real time, which narrows the gap somewhat, but they still don’t replace lab chemistry for diagnosing a specific failure mode.
The biggest failure in most oil analysis programs isn’t bad lab work. It’s the visibility gap between when a sample is drawn and when someone actually acts on the result. Closing that gap is what separates a functioning program from a filing cabinet full of reports.
Use sensors for continuous alerts on critical assets, and route any sustained alarm straight to a confirmatory lab sample rather than waiting for the next scheduled draw.
Turnaround Time, Costs, and How to Submit a Sample for Tracking
Standard oil analysis panels usually return results within a few business days once the lab receives the sample; extended testing with added elemental or particle-count analysis takes longer. Shipping delays and incomplete labels are the most common causes of slow turnaround, not lab backlog.
Costs vary by provider and panel depth, so confirm current pricing directly with your lab before budgeting. Pricing generally differs between standard and extended analysis panels, depending on included tests.
To keep your samples moving without a snag:
- Draw from a clean, consistent sampling point every time.
- Use the bottle the lab actually supplied, not a generic container.
- Label with the correct QR code or barcode tied to the right equipment ID.
- Fill out the sample submission form completely before shipping.
Tracking transit time, time-to-action, and correction rate gives you a real read on whether your program is catching problems early or just generating paperwork. If a sample shows as delayed or flagged for over 48 hours with no update, contact the lab directly rather than waiting for the automated status to change on its own.
Closing the Visibility Gap From Sample to Action
The technology behind oil analysis tracking has outpaced the discipline most teams apply to it. A great dashboard means nothing if nobody owns the follow-through.
Assign one person clear ownership of sample registration and alert response, with a real SLA attached. Automate critical alerts to a named responder, not a shared inbox. Attach every result PDF to the asset’s permanent history automatically, so five years from now nobody’s hunting through old email to reconstruct a maintenance timeline.
— Trent
Another Option: Closing the Loop With Maintenance Management Software
Portal dashboards solve sample visibility. What they don’t always solve is what happens after the alert fires, and that’s where a maintenance platform fits as a different piece of the puzzle. Instead of a flagged report sitting in an inbox waiting for someone to remember it, a connected system can attach that result directly to the aircraft’s maintenance record and flag it against upcoming inspection or compliance items.
This isn’t a replacement for your lab’s tracking portal. It’s the layer that keeps a lab result from becoming an orphaned PDF once it lands. If you’re a GA owner or flight school juggling multiple aircraft and want test results tied directly to each tail number’s history instead of a separate folder, take a look at how Squawkfree centralizes maintenance records and see if it fits how your fleet operates.
Sources
For more on sensor and lab methodology, see Fluid Intelligence’s explainer on oil condition monitoring and representative portal examples from TestOil’s DataSight and Fluid Life’s myLab.
- Triboelectric sensors for online oil condition monitoring — ACS/PMC
- LOAMS — Lube Oil Analysis Management System | Bureau Veritas
FAQ
How Much Does It Cost to Have Oil Analyzed?
Costs depend on the lab and panel depth, with standard wear-metal and contamination panels generally priced lower than extended panels that add particle counts or specialty additive testing. Confirm current pricing directly with your chosen lab before submitting a sample.
What Will Oil Analysis Tell You?
Oil analysis identifies contamination from fuel, water, or dirt, tracks wear metals from internal components, and measures chemical degradation through viscosity and additive-level testing, giving you data-driven insight instead of a guess about equipment condition.
Is Blackstone Oil Analysis Free?
Blackstone Laboratories offers a report on a submitted sample, but pricing and any free-analysis promotions vary and aren’t consistently listed, so check directly with the lab for current terms before shipping.
How Do I Get My Oil Analyzed?
Draw a sample from a clean, consistent point using the bottle your lab supplies, label it with the correct barcode or QR code tied to your equipment ID, complete the submission form, and ship it to the lab for testing. Once received, most labs update a tracking portal through stages like in transit, received, in analysis, and finalized, so you can watch the process rather than wait blind for an email.
Recommended
No credit card required · read-only after trial